Add data from text files (.txt or .csv)
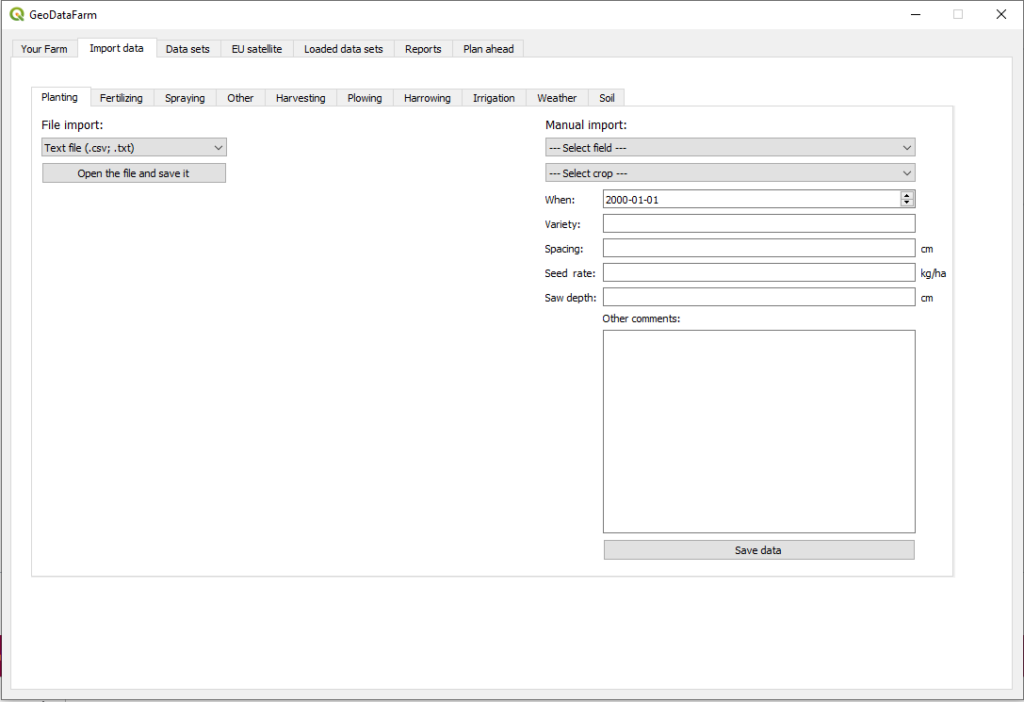
Go to the Import data tab. Here you can select between different types of operations in a secondary tab view.
In the picture to the left, the Planting tab is selected. If you just want to add some manual notes you can do that to the left else you can browse among the different file types and select Text file (.csv, .txt) and press on Open the file and save it.
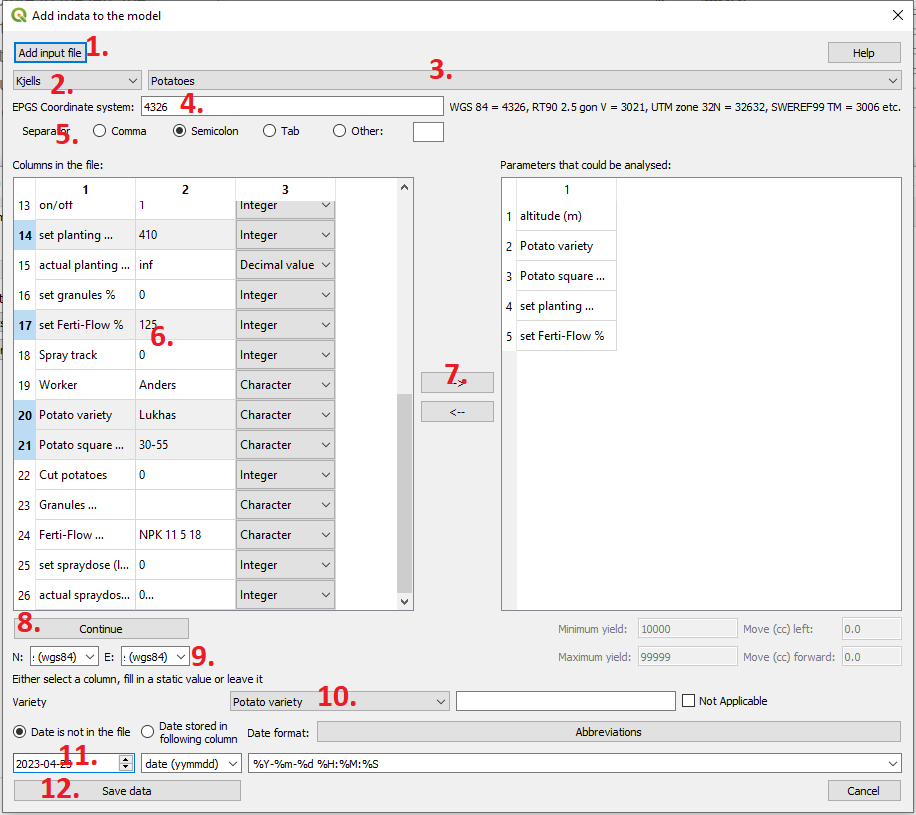
- Press “Add input file” and select your text file that you want to upload to GeoDataFarm, when this is added the upper field will be filled in like the illustration above.
- Select which field the data covers, it is important that you choose the correct field, data points outside the field will not be loaded.
- Select crop.
- Select coordinate system(EPSG), If you have a column with latitude and longitude it is probably WGS84, EPSG: 4326.
- Separator, the program tries to identify what separator that is used in the text file, if you can’t see the columns after you added the file try changing the separator.
- The first column is the heading row of your file, the second is the first data row the third is a guess of what kind of data the column consists of. There are three types of data, integer, decimal value character, make a quick check so the program has guessed the correct type of data.
- Select rows in the left table that would be interesting to analyse and “move” them to the right table.
- The columns that you have here will later be loaded as separate layers, this list can be alter later. When you have columns in the left side here you can press continue.
- When you press continue, the lower part of the dialog is filled in, Make sure that the program has guessed the correct N(orth) and E(ast) columns.
- Select the correct column that corresponds to the attribute at the left side. (In the case of planting, Variety), if no columns correspond to the attribute you can either give all data points the same value or exclude that column.
- Date, either you have a column in your file with a correct date or you fill it manual (then all data points gets the same date). If you have a column with the date you also need to specify which format the data is in.
- When you press <i>Save data</i> the program will start to import the data, this can take a few minutes if your data file is large.
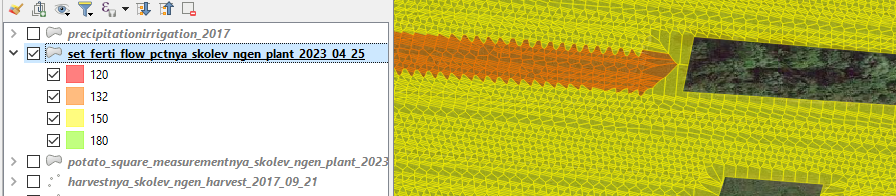
When the data is loaded, multiple layers (one for each row in the left table above) will be added to the QGIS canvas. On the left side of the screen there is a list of the layer names. The layer on top will be the layer on top of the others in the canvas. If you press the arrow “>” next to the layer name it will turn “˅” and you’ll get a legend of what the colors indicates. If you “untick” the checkbox the layer disappears. If you want edit which layers with different attributes that are added you can do this with the description under Edit data sets 2.